home
up
refresh
Location:
Name
Last modified
Size
Parent Directory
-
varDecom/
2018-04-09 17:46
-
scRNA/
2018-04-18 01:22
-
rgc/
2018-04-09 18:26
-
mouse-corr/
2020-07-17 09:35
-
linear-tissue-model/
2018-04-09 23:06
-
line-plots/
2018-05-01 14:20
-
DEG/
2018-04-09 18:11
-
chrom-states/
2018-04-22 09:26
-
aggregation/
2018-07-21 12:30
-
0h_groups.pdf
2018-06-05 16:51
62M
figure4.pdf
2019-10-08 00:47
35M
output.GIF
2019-10-08 19:58
18M
0h_25_groups.pdf
2018-06-05 15:40
9.7M
0h_S_up_groups.pdf
2018-06-05 17:14
9.1M
0h_reg_up_groups.pdf
2018-06-05 16:51
9.1M
0h__groups.pdf
2018-06-05 15:18
8.9M
0h_ctrl_groups.pdf
2018-06-05 16:51
8.7M
0h_C_up_groups.pdf
2018-06-05 17:14
8.7M
scatter.GIF
2019-10-08 20:09
7.3M
scatter2.GIF
2019-10-08 20:30
6.3M
scatter3.GIF
2019-10-08 20:30
5.5M
scatter4.GIF
2019-10-08 20:59
3.4M
test.GIF
2019-10-08 23:06
2.7M
rpkm_fraction.TPM_trypsin_filt.pdf
2018-04-09 15:57
2.0M
rpkm_fraction.TPM_trypsin_nonFilt.pdf
2018-04-09 15:57
1.9M
0h_reg_down_groups.pdf
2018-06-05 16:51
689K
0h_S_down_groups.pdf
2018-06-05 17:14
683K
0h_C_down_groups.pdf
2018-06-05 17:14
650K
180419_D00733_0322_ACCC66ANXX_ElenaVizcaya.pdf
2018-06-07 15:14
614K
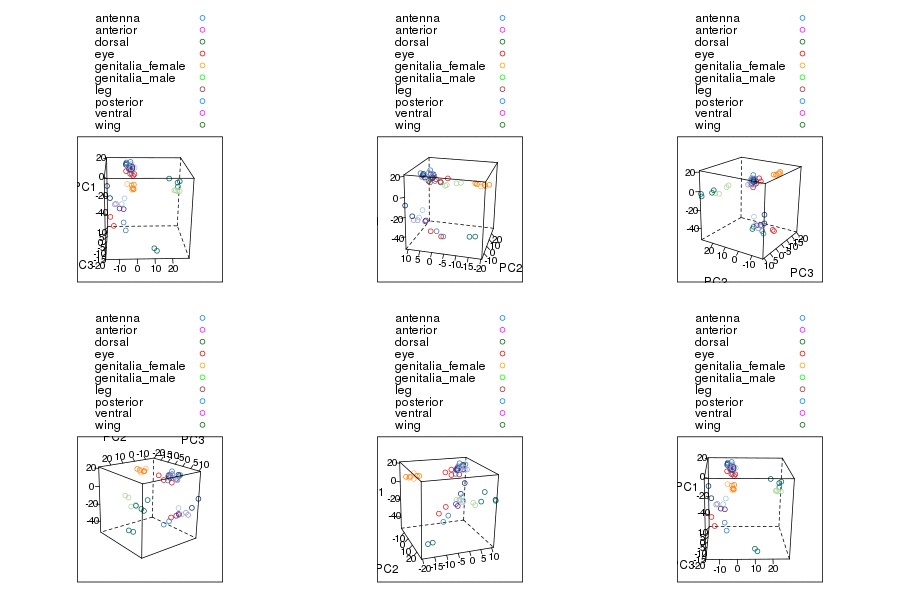
pca.3D.angles.pdf
2019-10-08 23:48
605K
tSNE.montage.erc.filter-rRNA-pseudogenes-dmel.trypsin.gene.TPM_new.idr_NA.pdf
2018-04-07 21:23
570K
evol.pdf
2019-01-21 16:18
419K
mouse_cns_E18_rep1_1_fastqc.html
2018-07-12 15:57
336K
tSNE.montage.comp.2018-04-04_trypsin_TPM.pdf
2018-04-17 22:45
317K
ggheatmap_genes_sortedDEG_avg_TPM_all_tissues.pdf
2018-10-22 03:37
310K
boxplot-peak-length.pdf
2020-05-05 18:36
237K
ggheatmap_genes_sortedDEG_avg_TPM_rdata.pdf
2018-10-22 03:37
218K
NIH3K27ac_peak.pdf
2018-05-25 16:48
196K
full.pdf
2019-02-07 12:57
169K
ggheatmap_genes_sortedDEG_avg_TPM.pdf
2018-10-22 03:37
165K
0h__groups.png
2018-06-05 15:01
155K
GO_modules.png
2020-06-23 08:43
153K
boxplot-merge-peak-length.pdf
2020-05-05 18:33
137K
SOM.pdf
2019-07-24 21:52
133K
H3K4me1.erc.pdf
2018-05-18 15:16
126K
H3K27ac.erc.pdf
2018-05-18 15:16
122K
RNApolII.erc.pdf
2018-05-18 15:16
121K
0h_ctrl_groups.png
2018-06-05 16:34
112K
boxplot-intersect-peak-length.pdf
2020-05-05 18:32
106K
teste.heatmap2.pdf
2018-06-06 22:33
105K
test2.pdf
2018-11-17 22:15
103K
0h_groups.png
2018-06-05 16:32
102K
GO_modules_top3.png
2020-06-23 08:59
100K
points.avg-peak-length.pdf
2018-07-29 01:16
92K
points.max-peak-length.pdf
2018-07-29 01:21
89K
sashimi.pdf
2019-02-07 12:38
86K
figure2.png
2020-04-19 19:48
85K
points.norm-avg-nbAlignments_color-by-phastCons.pdf
2018-07-29 01:35
85K
figureS3.png
2020-04-19 19:46
85K
H3K4me3_NG_ERC_QN.pdf
2019-03-22 13:42
83K
H3K4me3_NG_ERC.pdf
2019-03-22 13:43
82K
edgeR.cpm1.n2.out.pdf
2018-04-14 00:54
80K
points.diff-nbAlignments.pdf
2018-07-29 01:16
73K
edgeR.cpm1.n2.dv.pdf
2018-04-14 00:54
71K
points.norm-avg-nbAlignments.pdf
2018-07-29 01:26
70K
edgeR.cpm1.n2.ap.pdf
2018-04-14 00:54
68K
teste.heatmap.pdf
2018-06-06 22:43
66K
points.norm-avg-nbAlignments_non-core.pdf
2018-07-29 01:30
50K
heatmap_pearson_2018-04-04_trypsin_TPM.pdf
2018-04-09 16:07
45K
heatmap_pearson_inuse.idr.erc.dmel.selected.replicates.trypsin.gene.FPKM.idr_NA.pdf
2018-10-22 03:32
44K
GO_modules_all_shrinked.pdf
2020-07-31 09:44
43K
ggheatmap_TPM_comp.pdf
2018-04-14 13:38
42K
GO_modules_all.pdf
2020-06-23 09:11
34K
heatmap_pearson_projectionS4_ward.D2_woNum.pdf
2018-04-07 21:55
32K
boxplot.max.pdf
2018-07-29 01:11
31K
heatmap_pearson_ward.D2_numbersOff_2018-04-04_trypsin_TPM.pdf
2018-04-09 16:04
31K
boxplot.min.pdf
2018-07-29 01:11
31K
heatmap_AF.pdf
2019-02-02 00:52
30K
ggheatmap_TPM_dv.pdf
2018-04-14 12:35
28K
GO.pca.1_2.pdf
2019-01-30 17:21
28K
TF-counts-per-deg-minor-group-0-1_sorted.pdf
2019-02-02 11:12
20K
ggheatmap_TPM_ap.pdf
2018-04-14 12:33
20K
movie.gif
2019-10-08 16:53
19K
ggboxplot-permutations.pdf
2019-11-07 21:08
18K
TF-counts-per-deg-minor-group-0-1_sorted_subset.pdf
2019-02-02 11:13
17K
heatmap_SE.pdf
2019-02-02 00:52
16K
heatmap_A5.pdf
2019-02-02 00:52
15K
heatmap_pearson_inuse.idr.erc.dmel.selected.replicates.trypsin.gene.FPKM.idr_NA_all_plain.pdf
2018-10-22 03:31
15K
corr500-H3K4m3.pdf
2018-11-28 10:18
14K
corr-H3K4m3.pdf
2018-11-28 10:18
14K
boxplot.numberOfAlignments.pdf
2018-07-29 01:13
13K
test.pdf
2019-01-30 17:58
13K
heatmap_RI.pdf
2019-02-02 00:52
12K
GO_groups_allterms.pdf
2018-04-14 01:28
12K
GO_modules_top10.pdf
2020-07-31 09:41
12K
heatmap_A3.pdf
2019-02-02 00:52
11K
corr-WL3.pdf
2018-11-28 10:18
11K
corr500-WL3.pdf
2018-11-28 10:18
11K
tmp.pdf
2018-11-28 10:18
11K
prop_mapped_reads.png
2018-10-22 03:24
11K
GO_bg-DEG_most-specific_allterms_filtered_SGs_L3_WP.pdf
2019-10-05 23:22
11K
heatmap_AL.pdf
2019-02-02 00:52
10K
heatmap_MX.pdf
2019-02-02 00:52
10K
GO_bg-DEG_most-specific_allterms_filtered_TGs.pdf
2019-10-05 23:22
9.6K
GO_bg-DEG_most-specific_allterms_filtered_SGs.pdf
2019-10-05 23:22
9.0K
gene_profiles_rgc.pdf
2018-06-06 23:22
8.7K
GO_groups_allterms_filtered_all.pdf
2018-04-17 23:26
8.5K
boxplot.diff.pdf
2018-07-29 01:13
8.3K
Liver.e13.5.1.pdf
2019-07-24 21:52
8.2K
Liver.12wpc.27.pdf
2019-07-24 22:03
8.1K
barplot_ratioTPM_nonFilt.pdf
2018-04-09 15:46
7.9K
GO_groups_allterms_filtered.pdf
2018-04-17 23:17
7.6K
GO_modules.pdf
2020-07-31 09:35
7.5K
GO_modules_top3.pdf
2020-07-31 09:38
7.5K
barplot_ratioTPM_filt.pdf
2018-04-09 15:50
7.2K
barplot_sw_states_selected.pdf
2019-10-08 01:24
6.7K
barplot.faire-nrom-per-target-group-TF-target_sw_nbtargets.pdf
2019-11-06 23:40
6.6K
summary.out.pdf
2018-10-22 03:26
6.6K
GO_bg-DEG_most-specific_allterms_filtered_TSGs.pdf
2019-10-05 23:22
6.6K
barplot.faire-nrom-per-target-group-TF-TF_sw_nbtargets.pdf
2019-11-06 23:40
6.3K
pca.1_2.inuse.idr.erc.dmel.selected.replicates.trypsin.gene.FPKM.idr_NA.pdf
2018-10-22 03:29
6.1K
per7.tmp.map.pdf
2018-04-07 21:25
6.1K
DEG-in-cluster-minor-groups_byGeneType.pdf
2018-10-19 16:12
6.0K
GO_bg-DEG_most-specific_selectedterms_filtered_TGs.pdf
2019-10-05 23:31
5.9K
barplot.faire-nrom-per-target-group-TF-target_nbtargets.pdf
2019-11-07 00:04
5.9K
all-AG.pdf
2018-11-12 14:51
5.8K
barplot4.pdf
2020-06-05 09:59
5.8K
Genomic.Features.r6.36.pdf
2020-12-07 22:05
5.8K
GO_bg-DEG_most-specific_selectedterms_filtered_SGs.pdf
2019-10-05 23:31
5.8K
barplot.faire-nrom-per-target-group-TF-TF_nbtargets.pdf
2019-11-07 00:02
5.7K
barplot.H3K4me3.pdf
2019-11-07 02:10
5.6K
all-AEG.pdf
2018-11-12 14:54
5.6K
barplot.pdf
2020-06-05 09:59
5.4K
per4.comp.2018-04-04_trypsin_TPM.map.pdf
2018-04-17 22:50
5.3K
GO_bg-DEG_most-specific_selectedterms_filtered_TSGs.pdf
2019-10-05 23:31
5.3K
barplot3.pdf
2020-06-05 09:59
5.3K
barplot2.pdf
2020-06-05 09:59
5.2K
pca.3_4.labels.counts.gt5TPM2samples.pdf
2018-04-14 01:05
5.0K
pca.1_2.labels.counts.gt5TPM2samples.pdf
2018-04-14 01:05
5.0K
pca.1_3.labels.counts.gt5TPM2samples.pdf
2018-04-14 01:05
5.0K
pca.dv.deg.3D.pdf
2018-04-14 01:05
5.0K
nbPSI-envents.pdf
2019-02-01 22:54
5.0K
GO_groups_allterms_filt_projection_score.pdf
2018-04-09 16:19
5.0K
pca.ap.deg.3D.pdf
2018-04-14 01:05
5.0K
pca.1_3.ap.deg.pdf
2018-04-14 01:05
4.9K
pca.labels.counts.gt5TPM2samples.3D.pdf
2018-04-14 01:05
4.9K
pca.3_4.ap.deg.pdf
2018-04-14 01:05
4.9K
pca.1_2.ap.deg.pdf
2018-04-14 01:05
4.9K
pca.counts.gt5TPM2samples.batch.pdf
2018-04-14 01:05
4.8K
pca.ap.deg.batch.pdf
2018-04-14 01:05
4.8K
pca.3_4.dv.deg.pdf
2018-04-14 01:05
4.8K
pca.1_3.dv.deg.pdf
2018-04-14 01:05
4.8K
pca.1_2.dv.deg.pdf
2018-04-14 01:05
4.8K
pca.dv.deg.batch.pdf
2018-04-14 01:05
4.7K
proj.score.S4.pdf
2018-04-07 21:56
4.7K
Rplots.pdf
2019-03-22 13:42
3.5K