Input data and parameters
QualiMap command line
| qualimap bamqc -bam B7_H3K4me1_d_s.bam -gff genome.gtf -nw 400 -hm 3 |
Alignment
| Command line: | "/usr/local/bin/bowtie2-align-s --wrapper basic-0 --non-deterministic -x bowtie2genome -p 8 -U B7_H3K4me1.fastq.gz" |
| Draw chromosome limits: | no |
| Analyze overlapping paired-end reads: | no |
| Program: | bowtie2 (2.3.2) |
| Analysis date: | Fri Aug 10 15:55:44 UTC 2018 |
| Size of a homopolymer: | 3 |
| Skip duplicate alignments: | no |
| Number of windows: | 400 |
| BAM file: | B7_H3K4me1_d_s.bam |
GFF region
| Library protocol: | non-strand-specific |
| Outside statistics: | no |
| GFF file: | genome.gtf |
Summary
Globals
| Reference size | 2,725,537,669 |
| Number of reads | 36,547,722 |
| Mapped reads | 35,531,328 / 97.22% |
| Unmapped reads | 1,016,394 / 2.78% |
| Mapped paired reads | 0 / 0% |
| Read min/max/mean length | 35 / 76 / 75.07 |
| Clipped reads | 0 / 0% |
Globals (inside of regions)
| Regions size/percentage of reference | 1,168,286,534 / 42.86% |
| Mapped reads | 19,674,747 / 53.83% |
| Duplicated reads (estimated) | 383,413 / 1.95% |
| Duplication rate | 1.91% |
ACGT Content (inside of regions)
| Number/percentage of A's | 400,128,493 / 27.13% |
| Number/percentage of C's | 337,158,553 / 22.86% |
| Number/percentage of T's | 400,846,538 / 27.18% |
| Number/percentage of G's | 336,873,983 / 22.84% |
| Number/percentage of N's | 18,359 / 0% |
| GC Percentage | 45.7% |
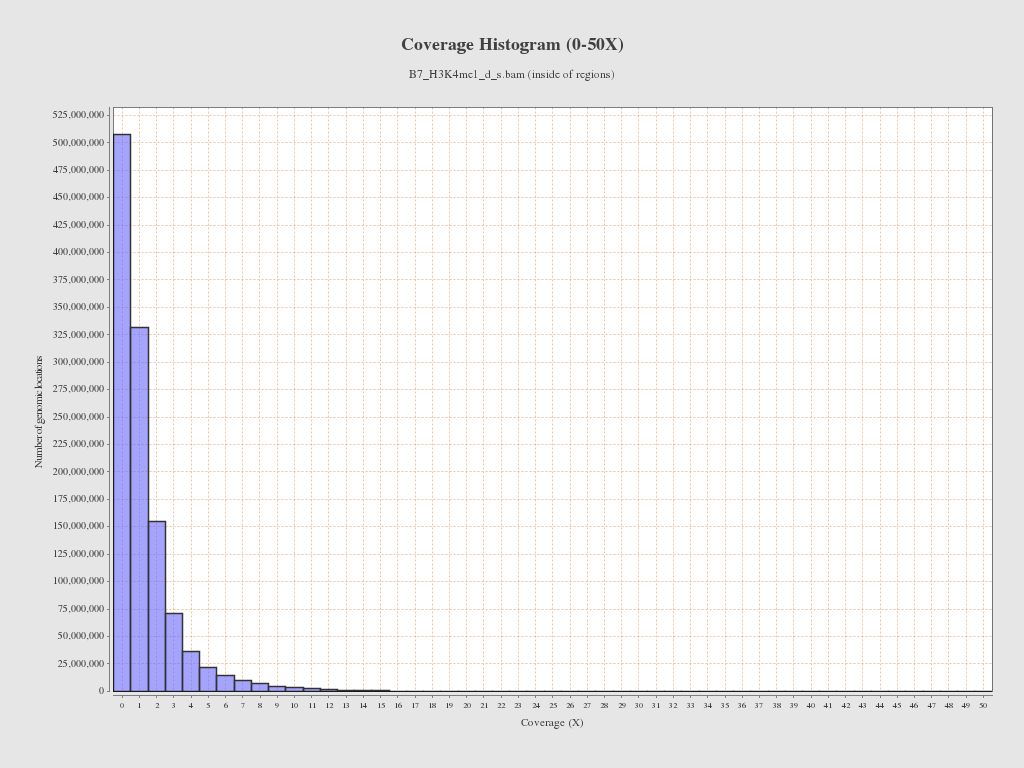
Coverage (inside of regions)
| Mean | 1.2627 |
| Standard Deviation | 1.921 |
Mapping Quality (inside of regions)
| Mean Mapping Quality | 38.78 |
Mismatches and indels (inside of regions)
| General error rate | 0.36% |
| Mismatches | 4,960,265 |
| Insertions | 139,218 |
| Mapped reads with at least one insertion | 0.36% |
| Deletions | 112,116 |
| Mapped reads with at least one deletion | 0.31% |
| Homopolymer indels | 47.41% |
Chromosome stats (inside of regions)
| Name | Length | Mapped bases | Mean coverage | Standard deviation |
| 1 | 87833224 | 98754330 | 1.1243 | 1.7019 |
| 2 | 91729544 | 107134369 | 1.1679 | 1.8148 |
| 3 | 63799692 | 68389698 | 1.0719 | 1.6198 |
| 4 | 70909143 | 82853719 | 1.1684 | 1.7229 |
| 5 | 74314364 | 90547793 | 1.2184 | 1.7837 |
| 6 | 70481271 | 84576352 | 1.2 | 1.7784 |
| 7 | 72394548 | 94934128 | 1.3113 | 1.8448 |
| 8 | 62305007 | 112509915 | 1.8058 | 2.4018 |
| 9 | 65205555 | 87619480 | 1.3437 | 2.5807 |
| 10 | 64472795 | 79582346 | 1.2344 | 1.7795 |
| 11 | 63004071 | 101016969 | 1.6033 | 2.1472 |
| 12 | 45140598 | 55943130 | 1.2393 | 1.7842 |
| 13 | 44652192 | 58058169 | 1.3002 | 1.7919 |
| 14 | 48751186 | 57181195 | 1.1729 | 1.8765 |
| 15 | 40767811 | 79485248 | 1.9497 | 2.6005 |
| 16 | 38505094 | 46992001 | 1.2204 | 1.7624 |
| 17 | 41899931 | 58486618 | 1.3959 | 1.9805 |
| 18 | 33695330 | 40316418 | 1.1965 | 1.7335 |
| 19 | 29501366 | 45733440 | 1.5502 | 2.0198 |
| X | 51516852 | 24029265 | 0.4664 | 0.9102 |
| Y | 7391595 | 1047127 | 0.1417 | 0.6023 |
| MT | 15365 | 7289 | 0.4744 | 0.7732 |


